
 Measure B failed, with 64.81% of the vote, when it needed 66.67% of the vote to pass. So, more people voted for than against, but not enough to overcome the 2/3 requirement for tax measures.
The SacBee has a map with its article on Measure B: Sacramento and Placer transportation taxes fail to pass (SacBee 2016-11-08) & http://www.sacbee.com/site-services/databases/article113389333.html, shown at right. The map only has two colors, and with red for failed, we think it over-emphasizes geographically large precincts with few voters, and over-emphasizes the less-than-2/3 precincts, so we created another.
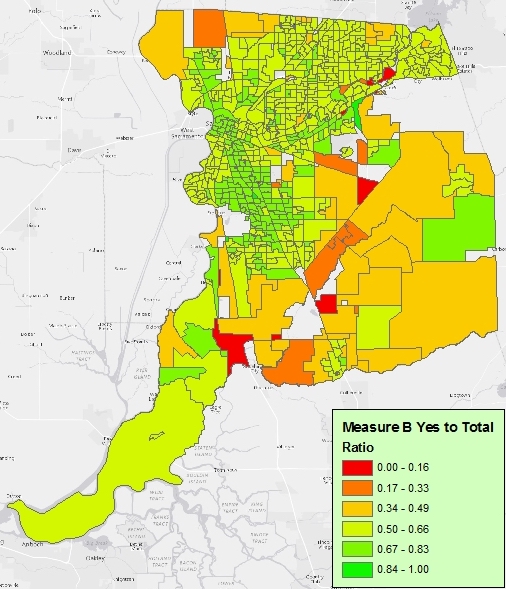 We grabbed the precinct map from the county GIS website, and the vote data from county elections, and joined them to produce my own map, at right and as a pdf The symbology is equal interval with six divisions. Green is the highest percentage of yes votes while red is the lowest percentage of yes votes, with the break between categories 4 and 5 being the 2/3 point, or 66.67%.
This map shows more subtlety, ranging from a very few very low yes no vote precincts to a very few very high yes vote precincts, and the majority in the middle area just below the threshold. The SacBee article states “A Measure B vote analysis by precinct shows the highest support for the tax was among Sacramento city and Rancho Cordova residents, and county residents living near freeways and light-rail lines. The lowest level of support was found in suburban areas such as Orangevale, Citrus Heights and Elk Grove, as well as in rural areas.” We suspect the high percentage along Hwy 50 and the Gold Line light rail is both due to many people using light rail there while many more stuck are in traffic on Hwy 50. The high in south Sacramento is probably due to low income residents who want effective transit and whose streets have been disinvested (potholes and deterioration) and neglected (few traffic calming features or bike lanes). Of course the central city was a high percentage, both because people use transit there and because politics are generally more progressive there. One can also see similarities between Democratic/Republican distribution and the Measure B vote.
We also suspect that a lot of the vote had to do with feelings about taxes, and specifically sales tax, and relatively less to do with transportation and transit.
STAR will have posts over the next few weeks detailing our ideas about “what’s next” after the failure of Measure B. We hope to be at the center of discussions about challenges, solutions, and funding.
