STAR has long objected to the SacRT practice of selecting light rail extensions without considering all the potential extensions, or additions. The Green Line to the Airport is politically popular, but no evidence has been provided that would indicate it is the best project for ridership and service. In fact, light rail to airports is not generally very productive (light rail to the airport?). We believe that SacRT should study all of the potential extensions, along with high frequency bus service that could be upgraded, to determine the next best investment.
To build a case for other options, we will provide some information about demographics (see the Wikipedia demography entry). At least for the start, the demographic data will be population density, median household income, SACOG’s Environmental Justice data based on Low Income High Minority measures, and Employment Centers from the census LEHD (Longitudinal Employer-Household Dynamics) data. Other perspectives might be worthwhile, but this is where we will start.
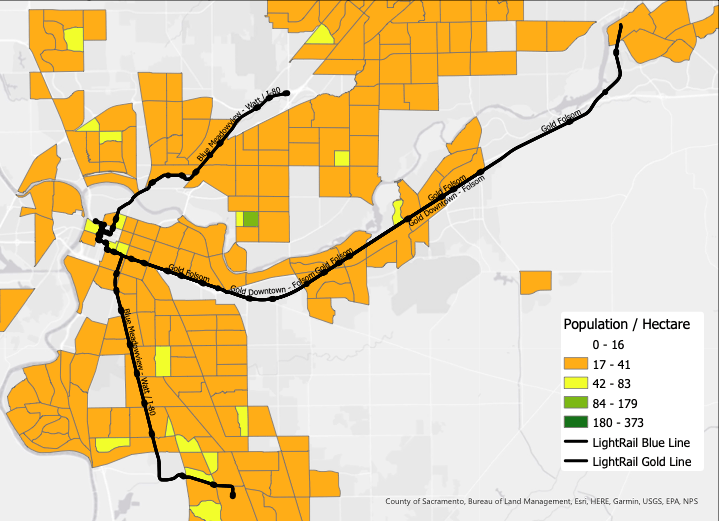
The first series of maps uses the existing light rail network, the Blue Line to Cosumnes River College on the south and Watt/I-80 on the north, and the Gold Line from Sacramento Valley Station to Historic Folsom.
Population Density: Census tract data on population density along the light rail corridors. Density is not the only measure of importance in projecting ridership, and in fact Spieler suggests that density around stations is much more important. Light rail serves some moderately dense census tracts, but misses higher density, and serves several areas of very low density, approaching Watt/I-80 and between Sunrise and Folsom. pdf
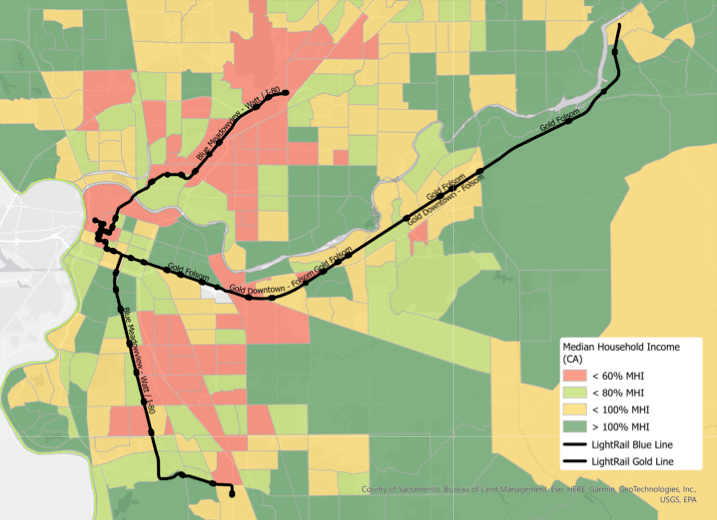
Median Household Income (MHI): Census tract data on median household income along the light rail corridors. Formerly, light rail was heavily used by high income suburban residents during the morning and evening commutes, and by mostly low income people at other times. It is not known what patterns will be after the pandemic. Light rail serves some low income areas and is not too far from others, but it also services many tracts above 80% of MHI. pdf
Low Income High Minority (LIHM): Low income, high minority locations are a standard way of identifying areas that need more services. SACOG (Sacramento Area Council of Governments) has taken this concept to identify Environmental Justice areas in the region, which are mapped with the light rail network below. The Blue Line as far as Meadowview station serves these areas well, but the rest of the network does not. pdf

Destinations: Of course design of light rail and bus networks is not just about who is riding, but about where they are going, their destination. The following map shows three types of destinations: higher education, medical services (in this case, just hospitals, which are only a portion of health related trips), and employment centers. The employment center data comes from the LEHD (Longitudinal Employer-Household Dynamics) census data. Only significant centers are shown on the map. People often ask about shopping destinations. The county Shopping dataset has thousands of entries, with no way to distinguish large malls from corner retail, so we have shied away from that measure. Certainly many other destinations could be considered, but we are starting with these three. You will note that several employments centers are medical facilities and higher education locations. Light rail serves several destinations in the central city and urban areas, but misses many others. pdf

This is the first of what will be many posts on light rail (and high frequency bus routes). What questions do you have? What criteria do you think should be considered?

One thought on “light rail and demographics”