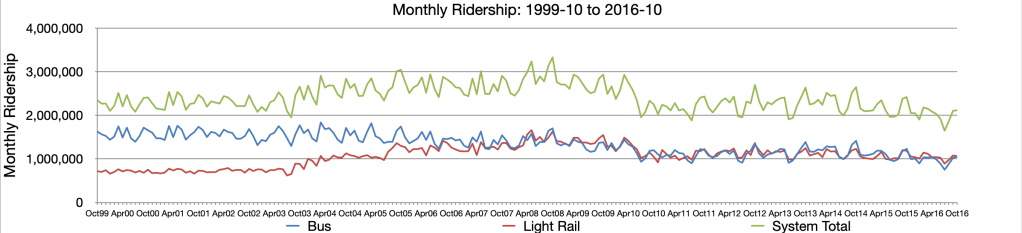
The following two charts show ridership trends for SacRT, in categories of fixed route bus, light rail, and demand-response, which includes SacRT Smart Ride but does not include Paratransit. A previous post showed ridership by bus routes.
The first chart shows the period 1999-10 through 2016-10. The X-axis interval is not consistent because the months reported in the quarterly reports were not consistent, but the overall trend is clear. During this period, bus ridership declined and light rail ridership increased, but both have leveled off, with each about equal parts of ridership. There is a noticeable decline in ridership, but that is consistent with most transit agencies, as transportation agencies continue to subsidize motor vehicle travel at the expense of other modes.
The second chart shows the period 2018-03 through 2022-06, for one month each quarter. The grey line at the bottom mostly represents the SacRT Smart Ride on-demand service, which is an increasing but still very tiny part of overall service. The chart shows. The steep decline, to less than half former ridership, due to the pandemic, is clear, as well as the gradual recovery.

Data for the period from 2016-10 through 2018-03 is not publicly available.

One thought on “SacRT ridership trends”