Note: These maps are out of date, reflecting the SacRT system before SacRT Forward system redesign in 2019. Updated maps will be made available as resources allow.
As an experiment, STAR is using a new ESRI ArcGIS Online feature, Atlas. A simple set of maps and features is available. Check it out. Over time, demographic features will be added, making many of the maps below out of date.
STAR has compiled several maps showing the SacRT system or network of light rail and bus routes, and has also borrowed maps developed by Getting Around Sacramento. The set below is an attempt to present these in a common scale and line type (symbology). Apologies to the region – though we think of ourselves as a region, and think coordination of transit across the region is critical, we only have resources at this time to focus on SacRT. Folsom and Elk Grove also operate transit within the county, but again, not shown.
Maps that have been updated since they were used in posts will be found here, and additional maps will be added as they are used in posts, or updated. Where a pdf of the image is also available, you can click to access it or download it. Scroll to the bottom for a slide show of current maps.
The Future
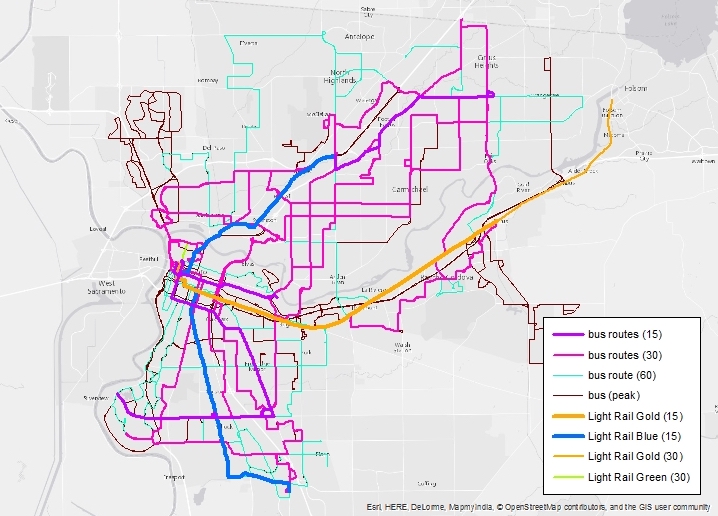
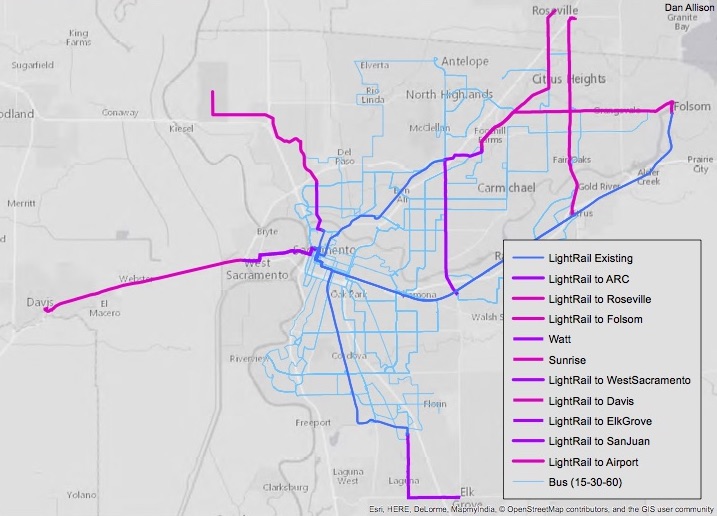
The System

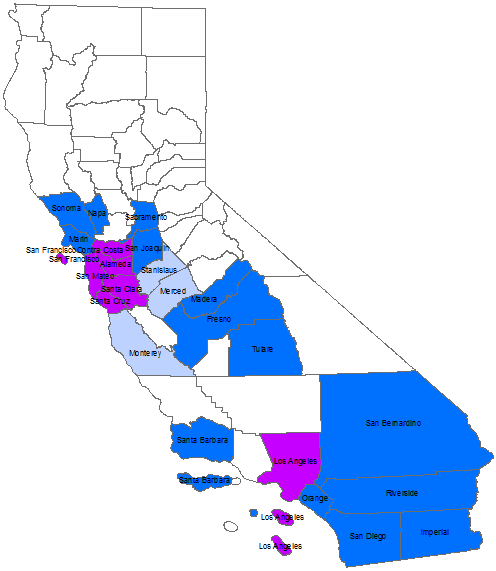
County Context
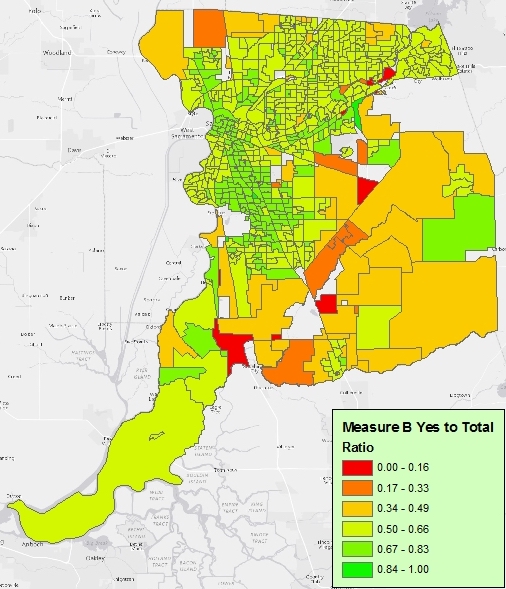
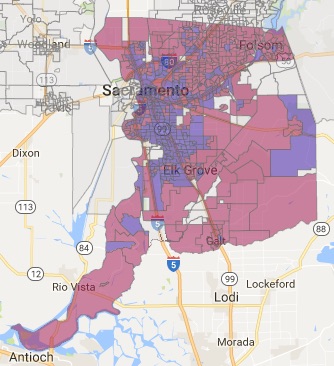
Measure B votes by precinct. (2016-11-09)
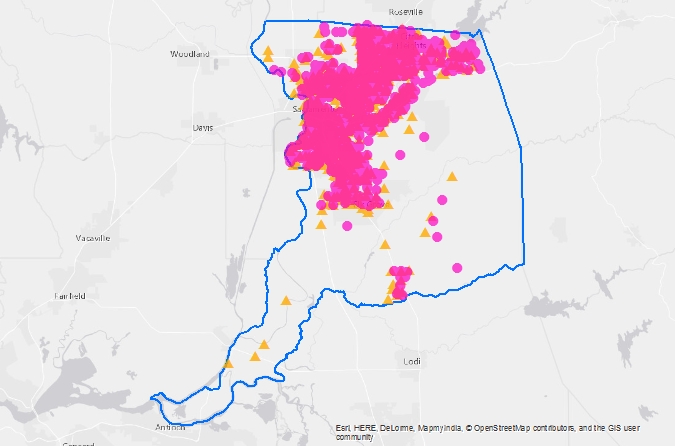
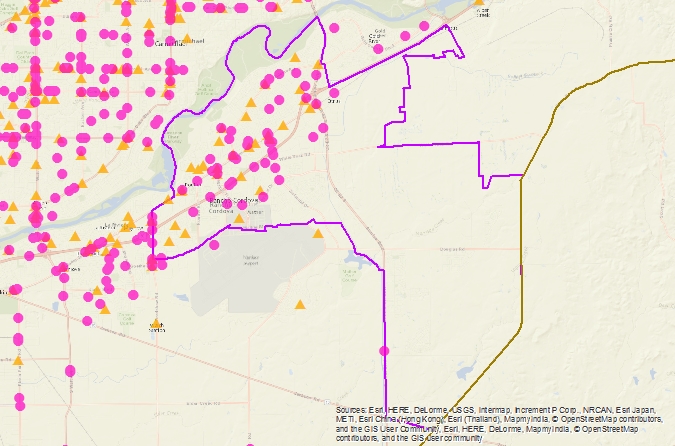
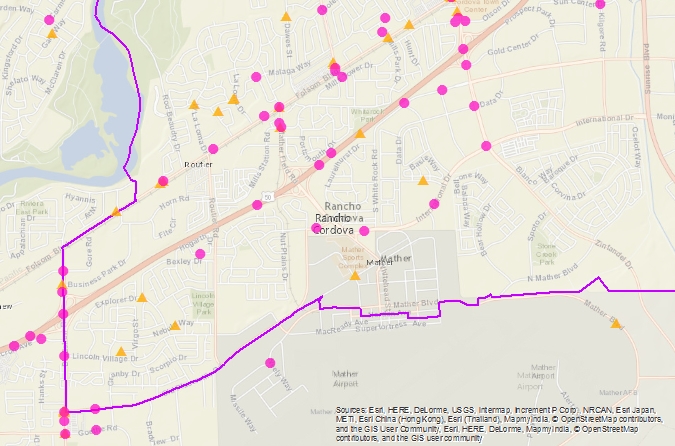
Sacramento County collision points, red circle bicyclist, yellow triangle pedestrian. (2016-11-06)
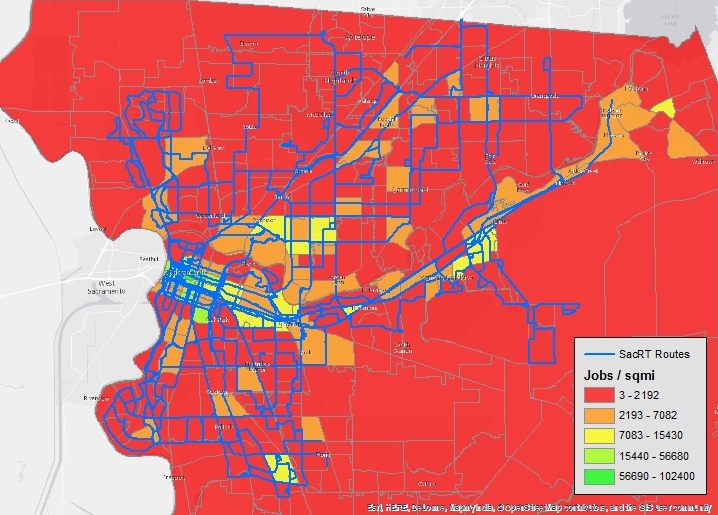
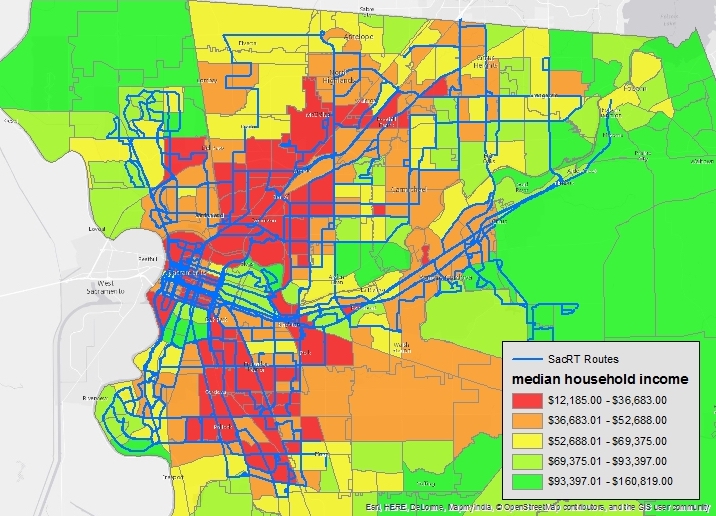
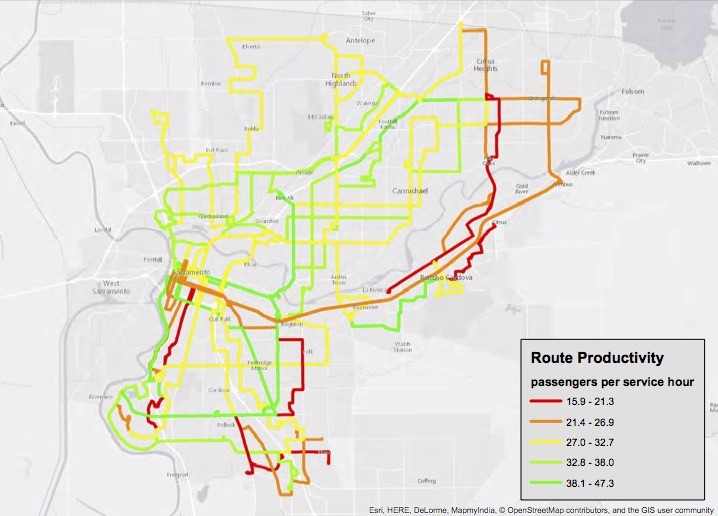
SacRT routes and various parameters

SacRT route productivity (bus only, not light rail). (2016-05-24)

Slideshow of current maps.
2016
- Sacramento County collisions
- Sacramento County collisions Rancho Cordova
- Sacramento County collisions Rancho Cordova zoom
- SacBee Measure B vote
- Sacramento County Measure B vote crop
- Counties Transportation Sales Tax
- Counties Transportation Sales Tax Measures 2016
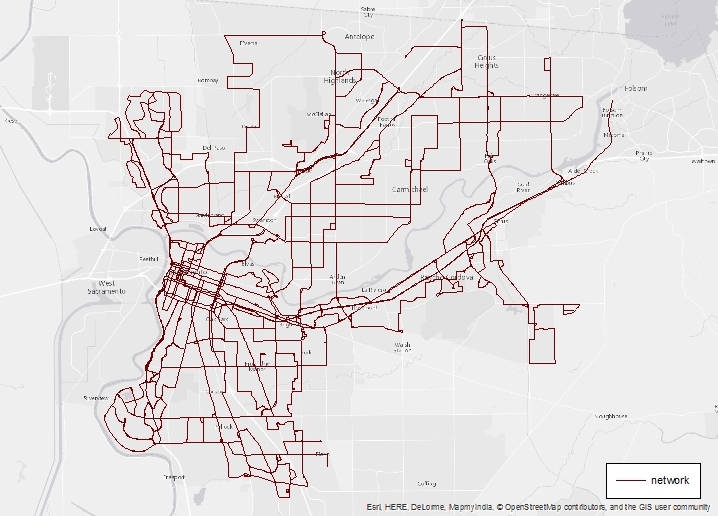
- SacRT Network
- SacRT low frequency network
- SacRT medium frequency network
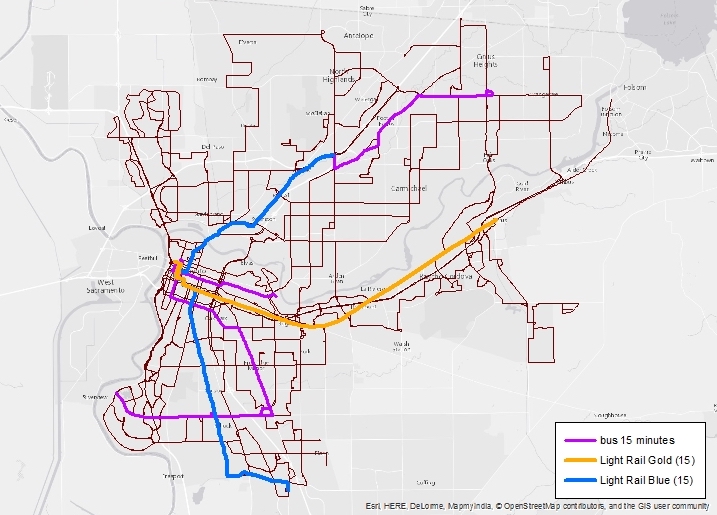
- SacRT high frequency network
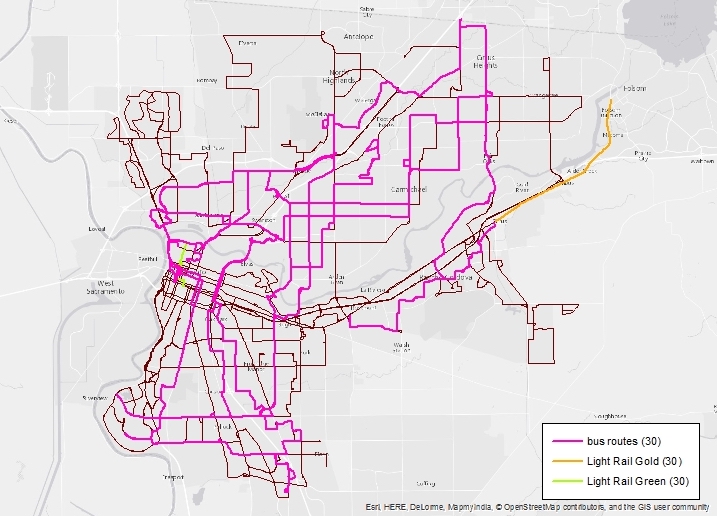
- SacRT network all frequencies
- SacRT route productivity
- SacRT routes & employment
- SacRT network & population density
- SacRT network & household income 2016
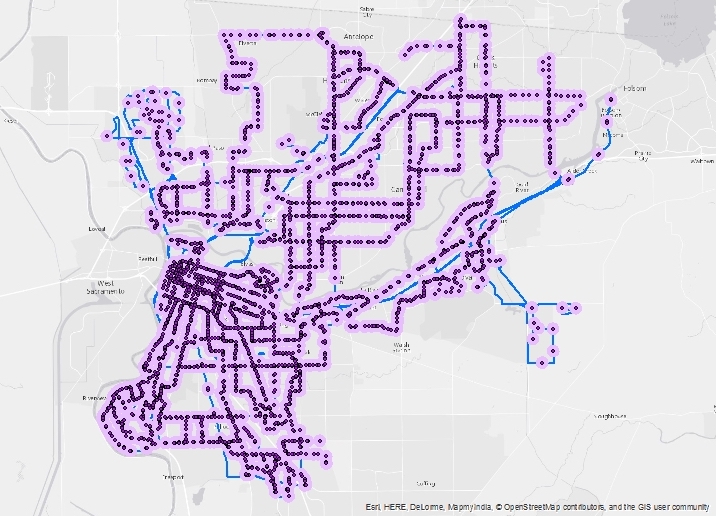
- SacRT stops with 0.25 mile walking distance buffers
- SacRT stops with buffer & population density
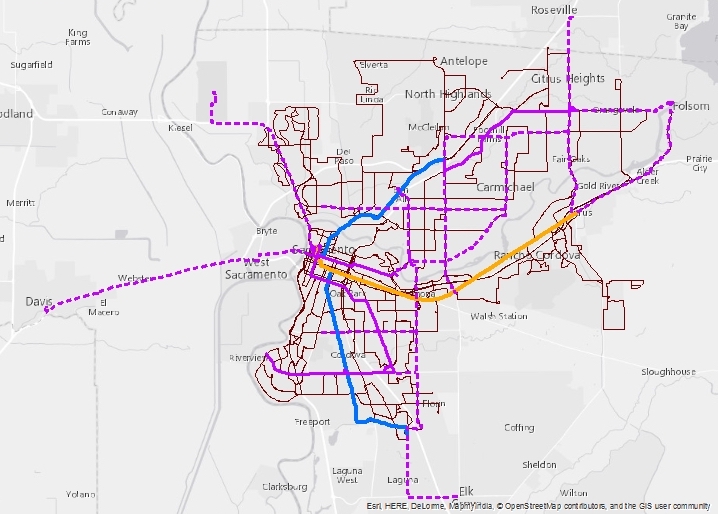
- potential high frequency network
2017
